Errors first, not on line 4,812.
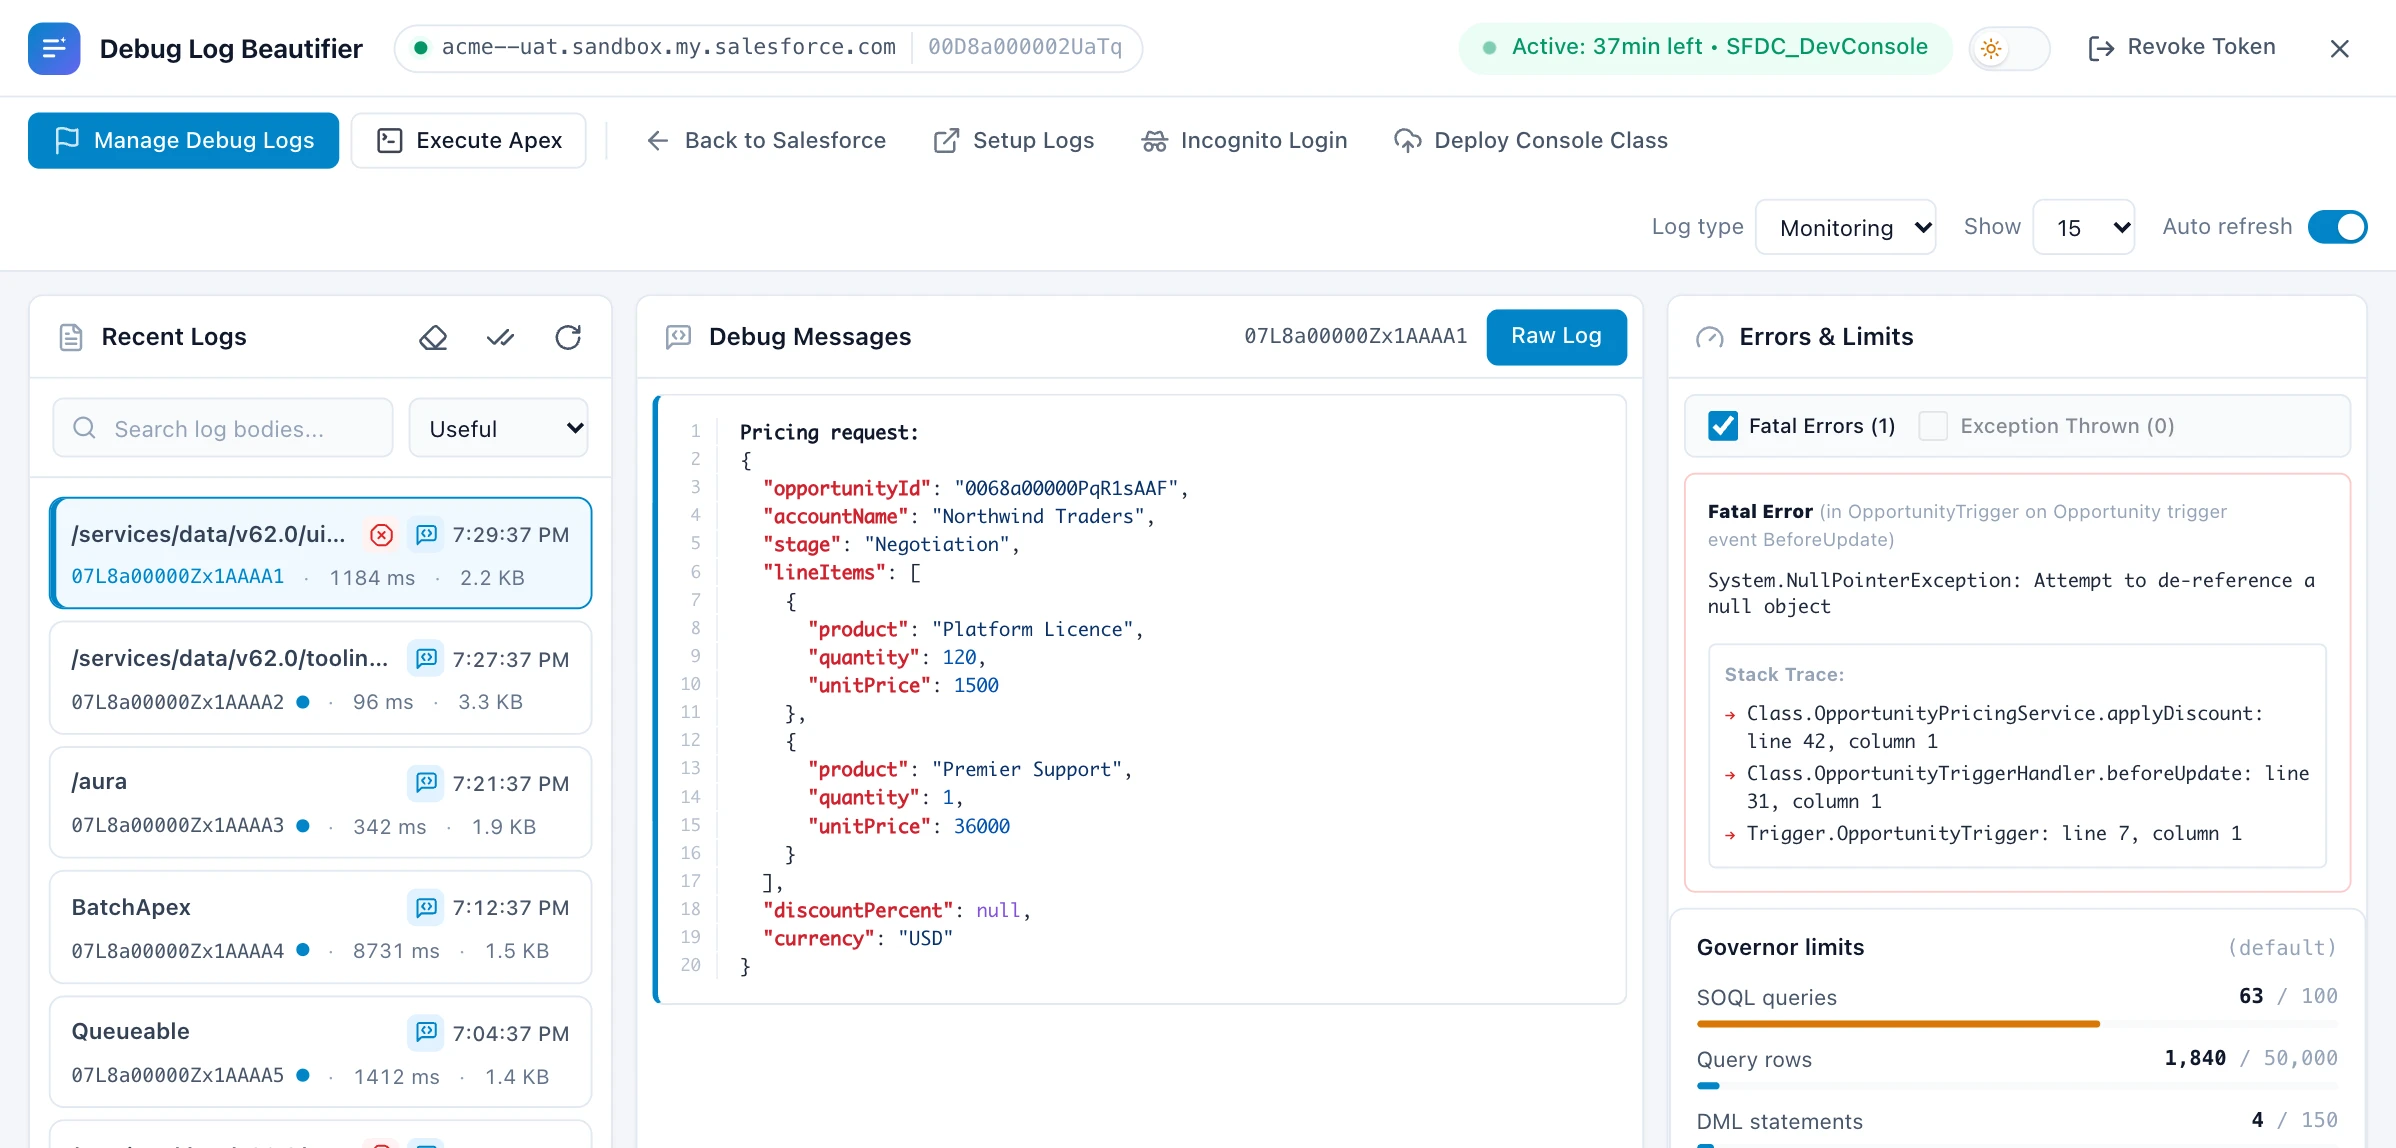
Fatal errors and exceptions jump to the top, with clean stack traces that point at the exact class, line and column.
Free Chrome extension
Raw debug logs are thousands of lines of noise. Debug Log Beautifier pulls out what matters: your System.debug output as clean JSON, errors and stack traces first, governor limits at a glance.
⌥ Option⇧ ShiftD on any Salesforce tab opens your logs
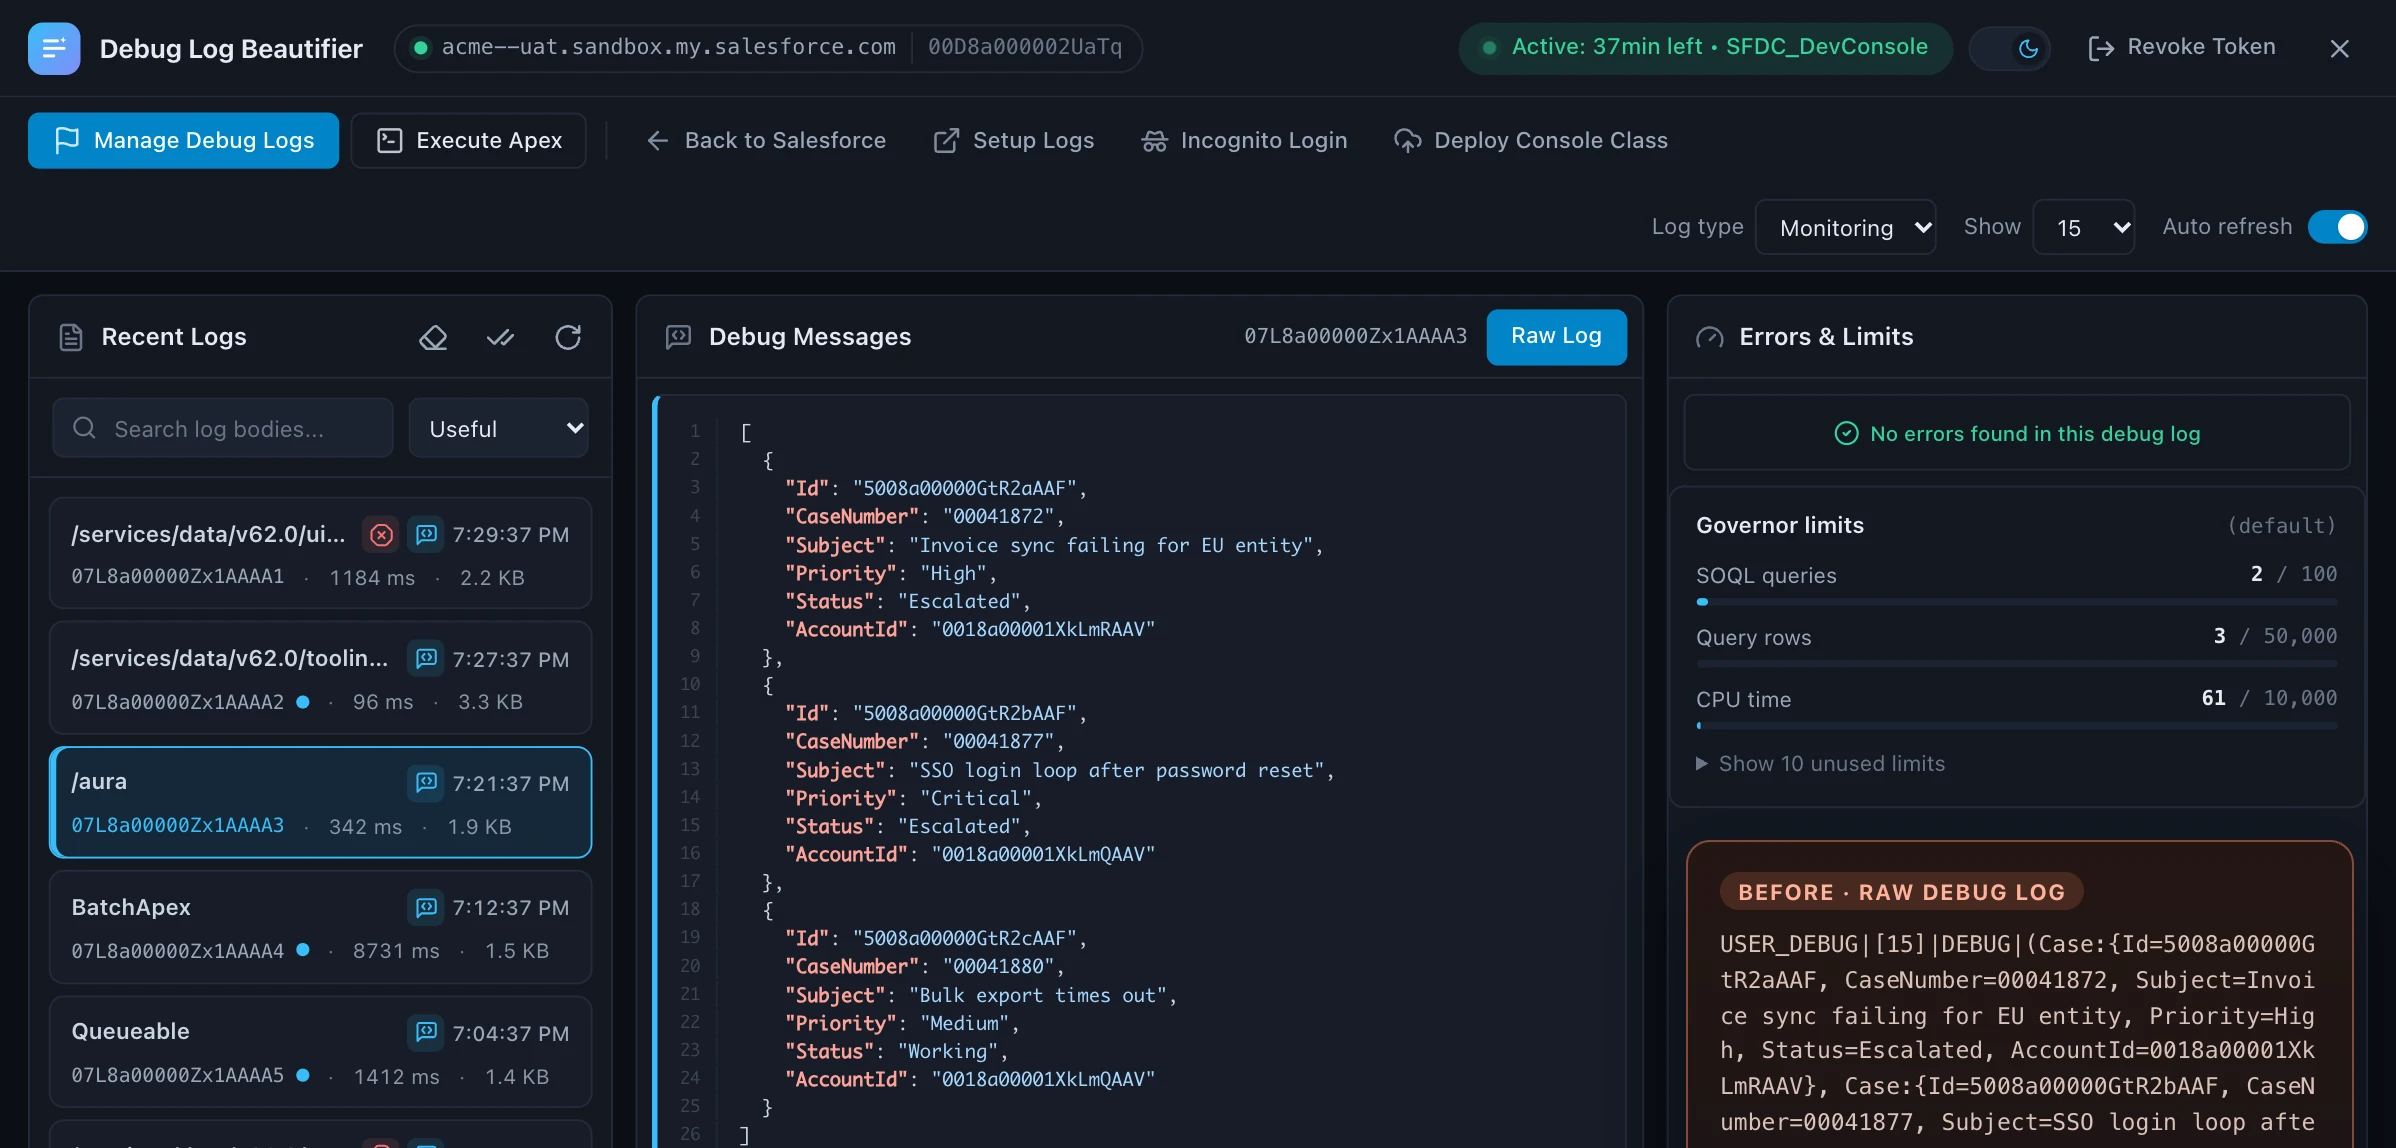
Records, lists, maps, sets and wrapper classes are parsed and highlighted. No JSON.serialize needed. Drag the divider.
[
  {
    "Id": "5008a00000GtR2aAAF",
    "CaseNumber": "00041872",
    "Subject": "Invoice sync failing for EU entity",
    "Priority": "High",
    "Status": "Escalated",
    "AccountId": "0018a00001XkLmRAAV"
  },
  {
    "Id": "5008a00000GtR2bAAF",
    "CaseNumber": "00041877",
    "Subject": "SSO login loop after password reset",
    "Priority": "Critical",
    "Status": "Escalated",
    "AccountId": "0018a00001XkLmQAAV"
  },
  {
    "Id": "5008a00000GtR2cAAF",
    "CaseNumber": "00041880",
    "Subject": "Bulk export times out",
    "Priority": "Medium",
    "Status": "Working"
  }
]
Logs, limits, trace flags and anonymous Apex live one shortcut away from any Salesforce page.
Fatal errors and exceptions jump to the top, with clean stack traces that point at the exact class, line and column.
SOQL, DML, CPU, heap and callouts as progress bars. Managed package namespaces included.
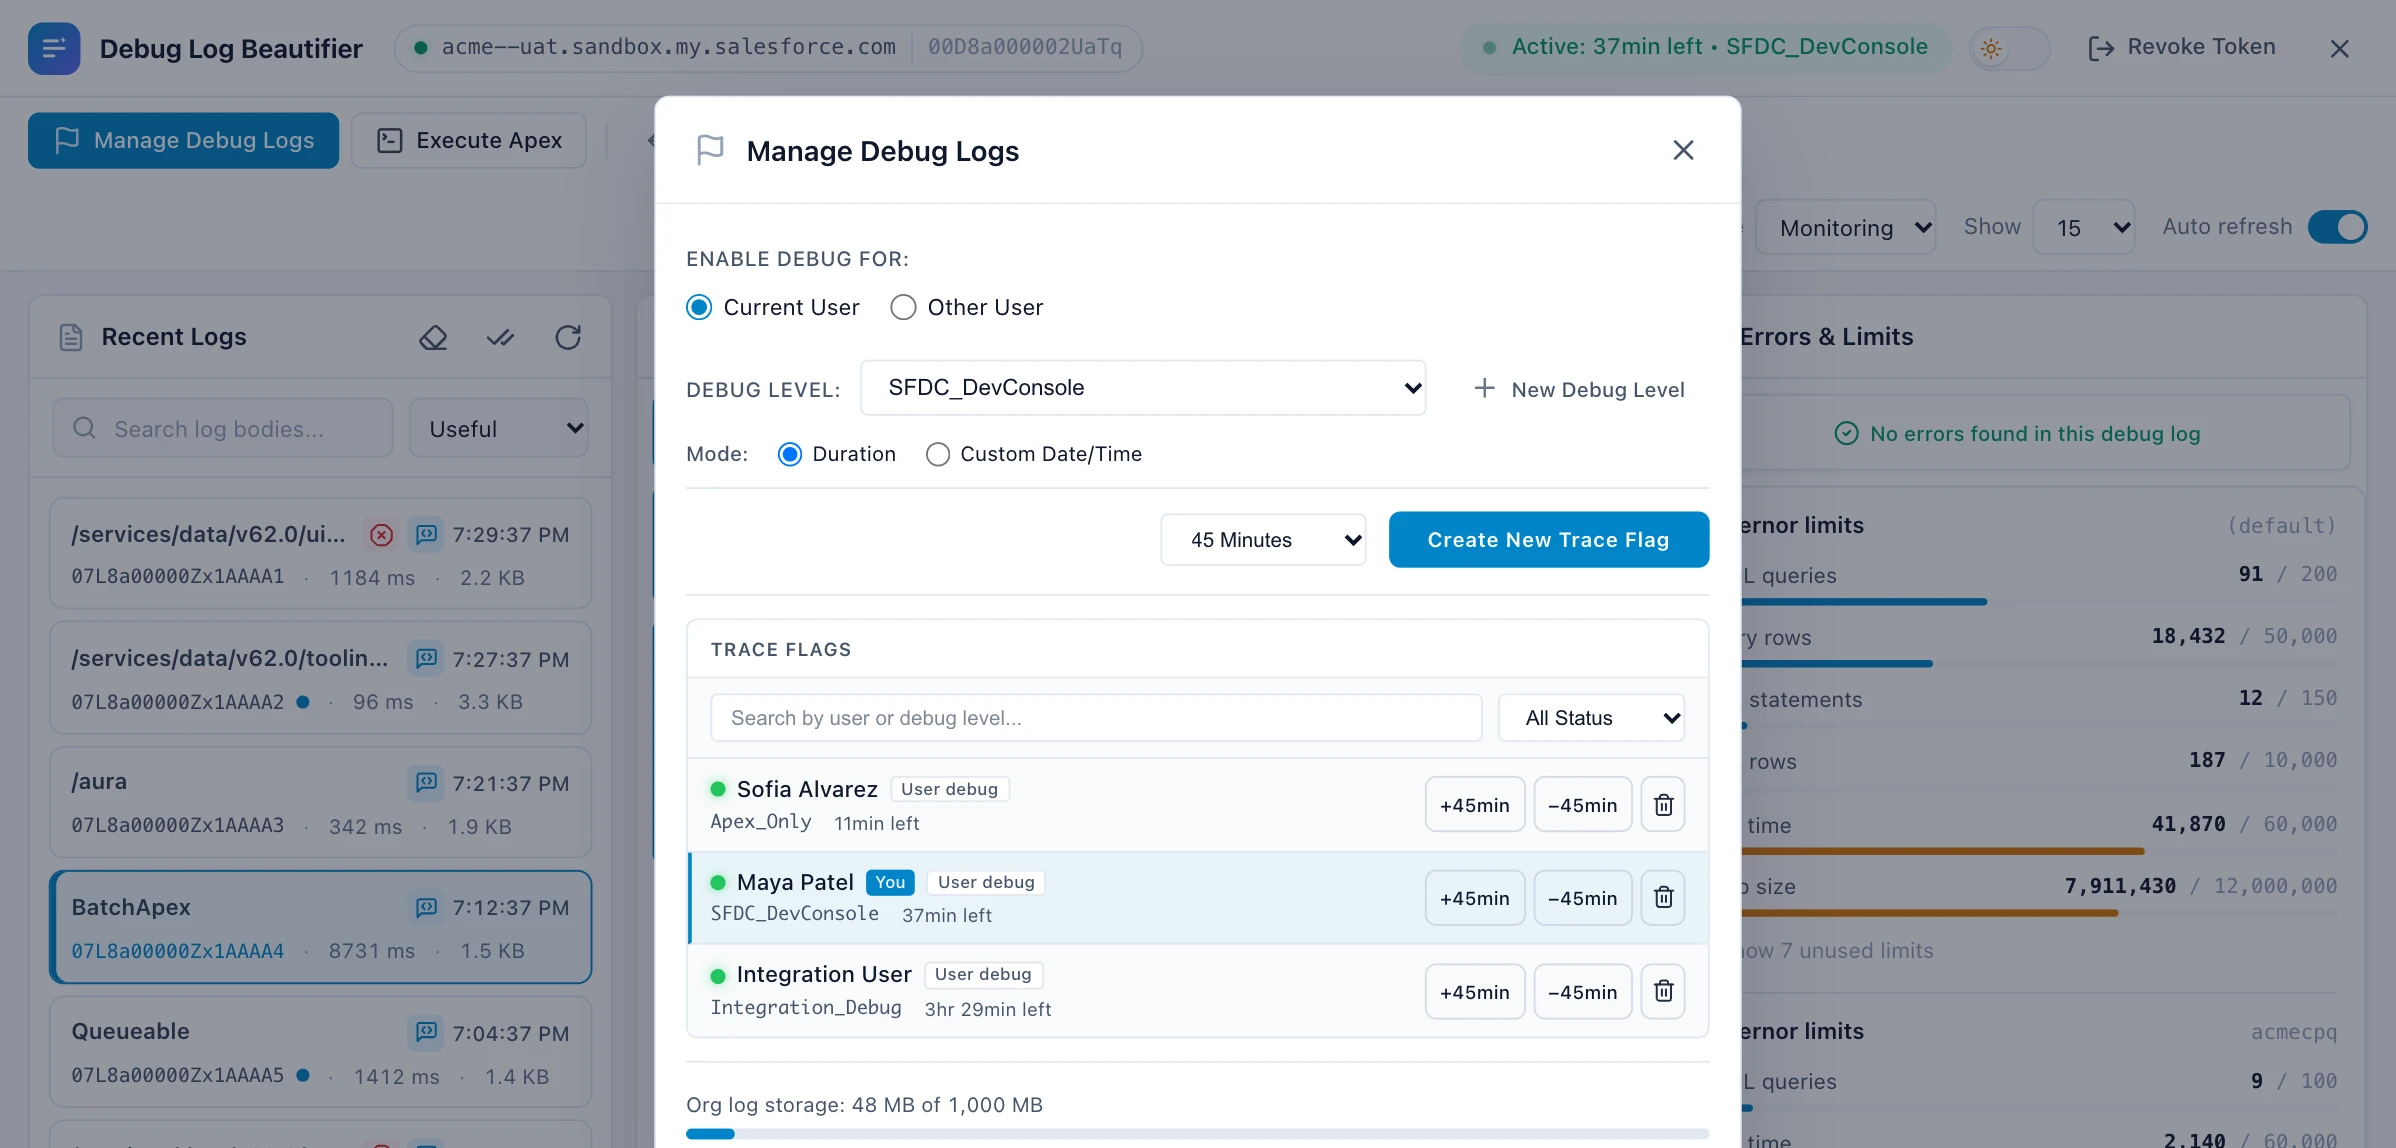
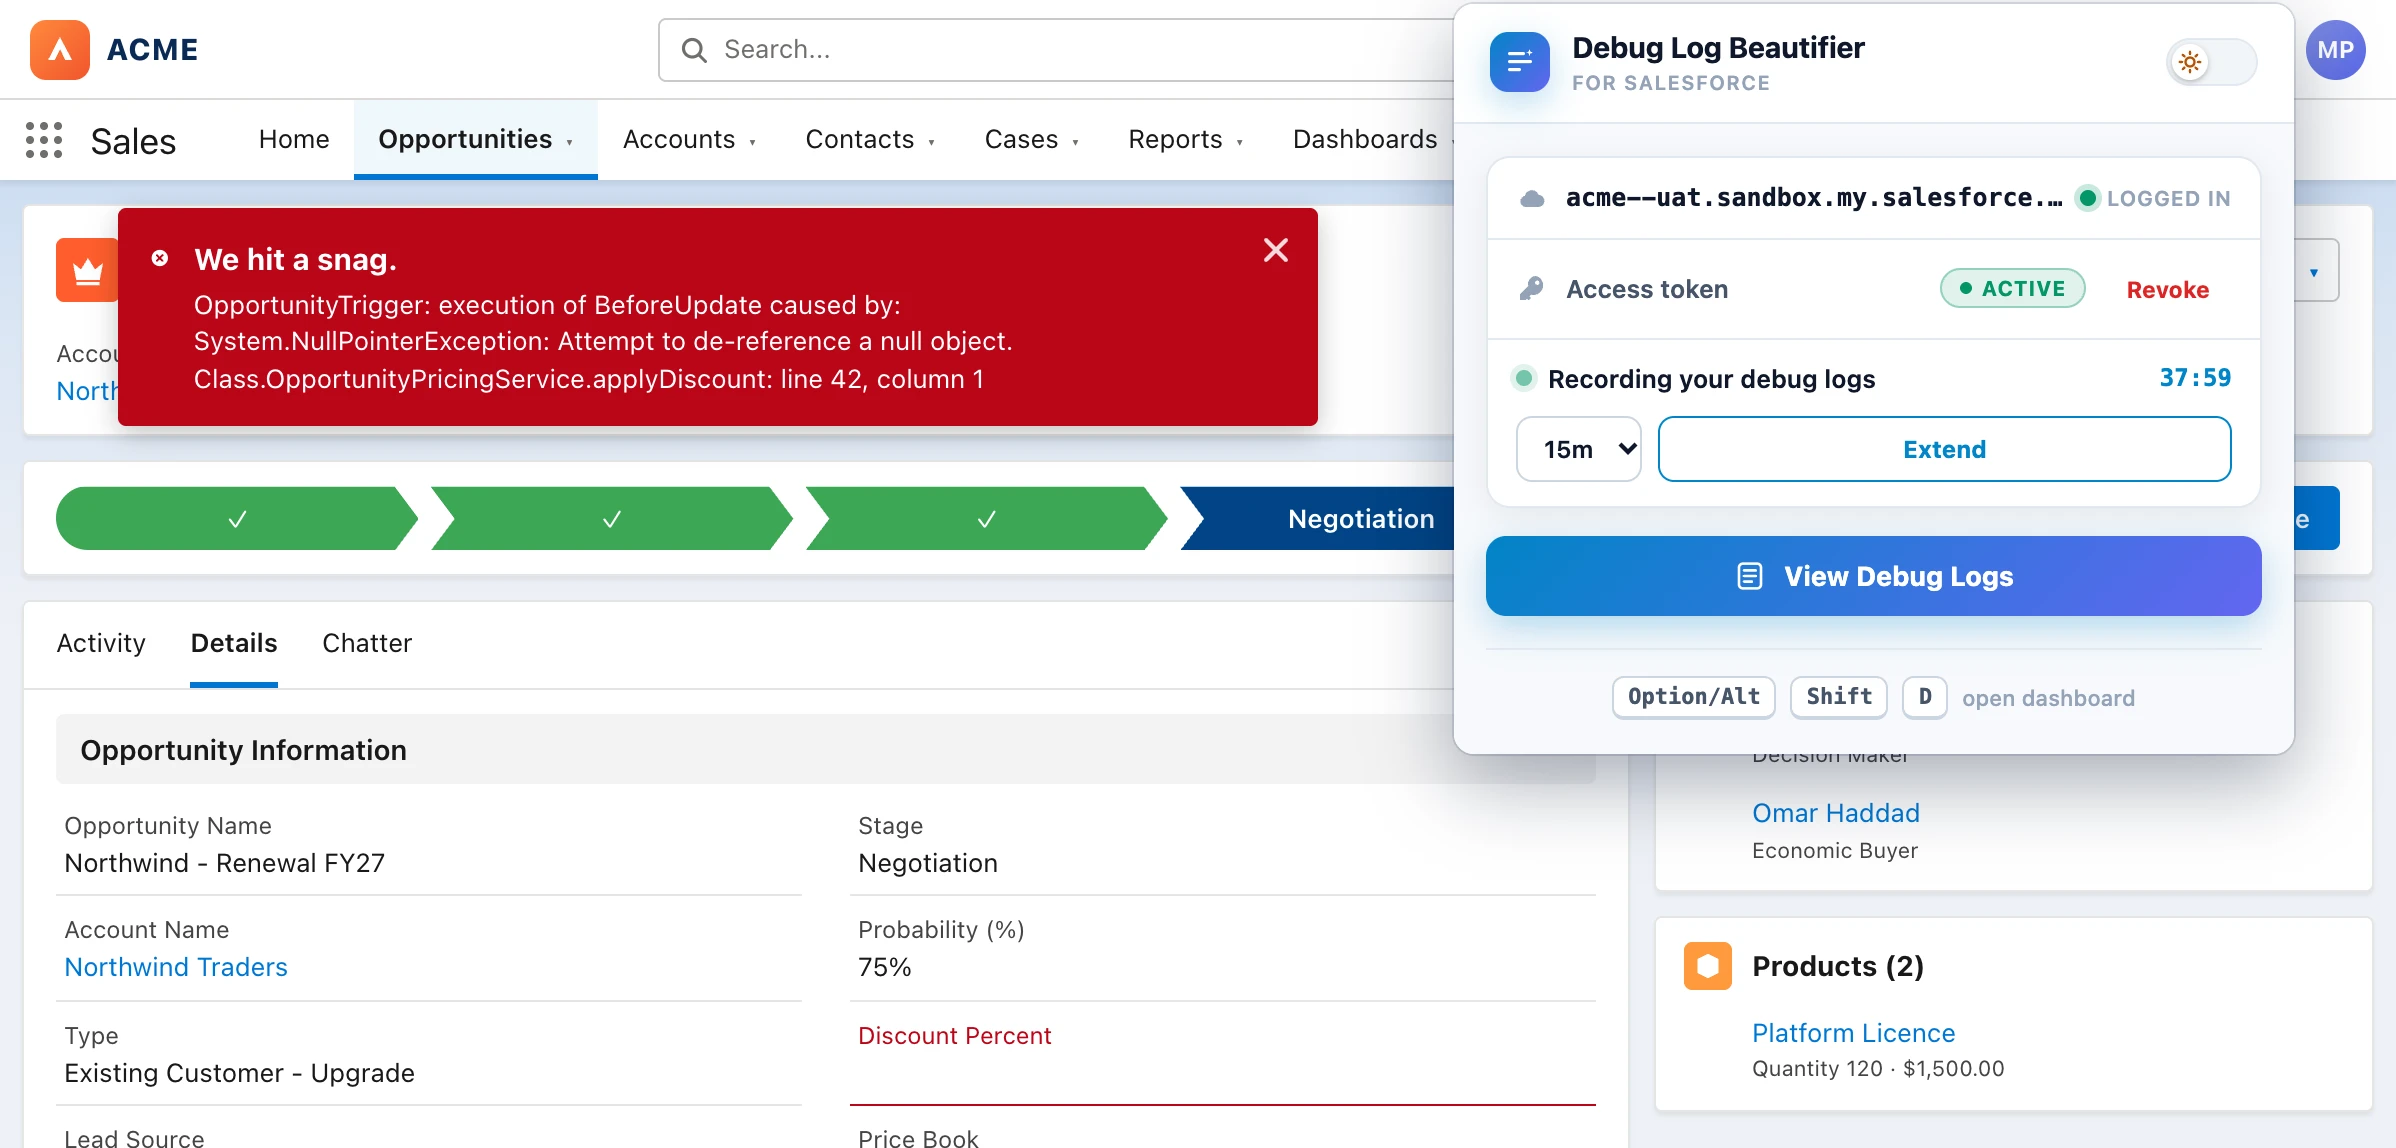
Turn on logging for yourself or any user, pick or create a debug level, then extend, shorten or stop it with one click.
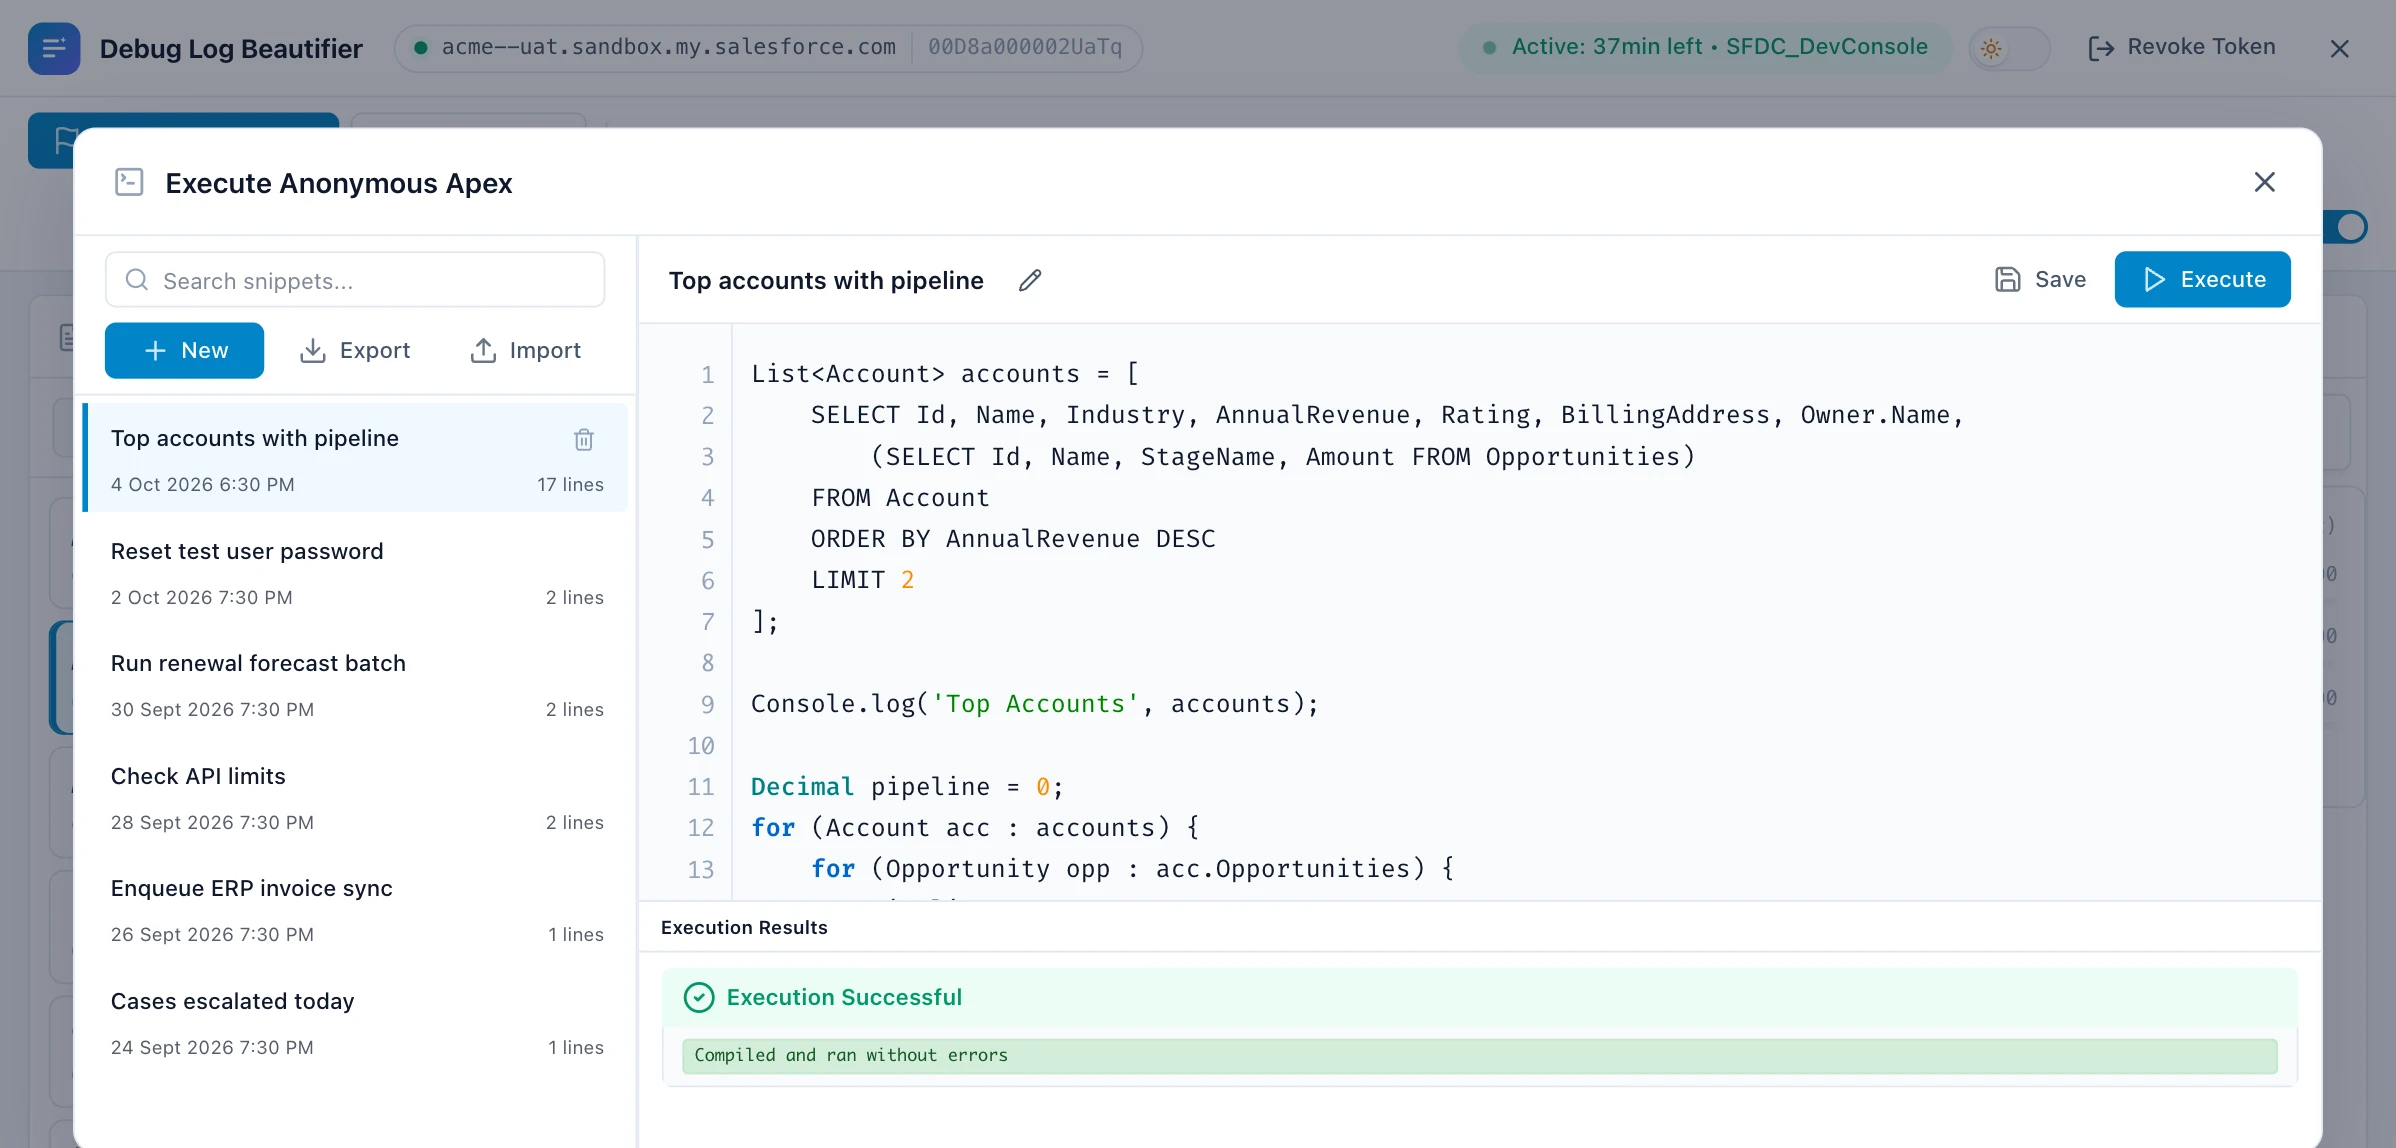
Save the code you run every day, then search, import and export it. Compile errors point to the exact line.
Across log bodies, and inside the raw log.
Show logs with debug output or errors. Hide the rest.
New logs arrive while you work. Mark them as read.
Two themes, one toggle, remembered everywhere.
Five screens from the extension, running on a sample sandbox.
System.debug. Your logs arrive already beautified.// Built in. Works out of the box System.debug(accounts); // Pretty JSON is shown the way it should look System.debug(JSON.serializePretty(accounts)); // Optional Console class, one click to deploy Console.log('My Accounts', accounts);
The extension talks only to your Salesforce org, with your own session or OAuth token. There is no server in between.
 Your browserDebug Log Beautifier
Yes. Install it from the Chrome Web Store and log in with your own Salesforce account. There is no separate sign-up.
Production, sandbox, scratch and Developer Edition orgs, including My Domain, Lightning and Setup domains.
No. Plain System.debug of records, lists, maps, sets and wrapper classes is turned into JSON for you, and JSON.serializePretty output is shown the way it should look.
No. Opening the dashboard turns on a 45-minute USER_DEBUG trace flag for you if none is active, and when it expires the extension simply forgets it. Logs are only deleted when you delete them, or if you turn on automatic cleanup, which is off by default.
Since September 2025 Salesforce can block apps that are not installed in your org. Ask your admin to install it (Setup › Connected Apps OAuth Usage › Install), or create your own External Client App and paste its consumer key under OAuth setup in the dashboard.
It stays in your browser. The extension talks only to your Salesforce org, with your own session or OAuth token. No analytics, no tracking, no external servers, and you can revoke the token at any time. Privacy policy.
Free for Salesforce developers, admins and consultants. Works on every org you log in to.
Add to Chrome, it’s freeThen press⌥ Option⇧ ShiftD